On December 17th 2015, Arduino released their IDE version 1.6.7 which allows multiple values to be plotted in the serial plotter. We have set up an example to show you how to use this feature.
The Serial Plotter
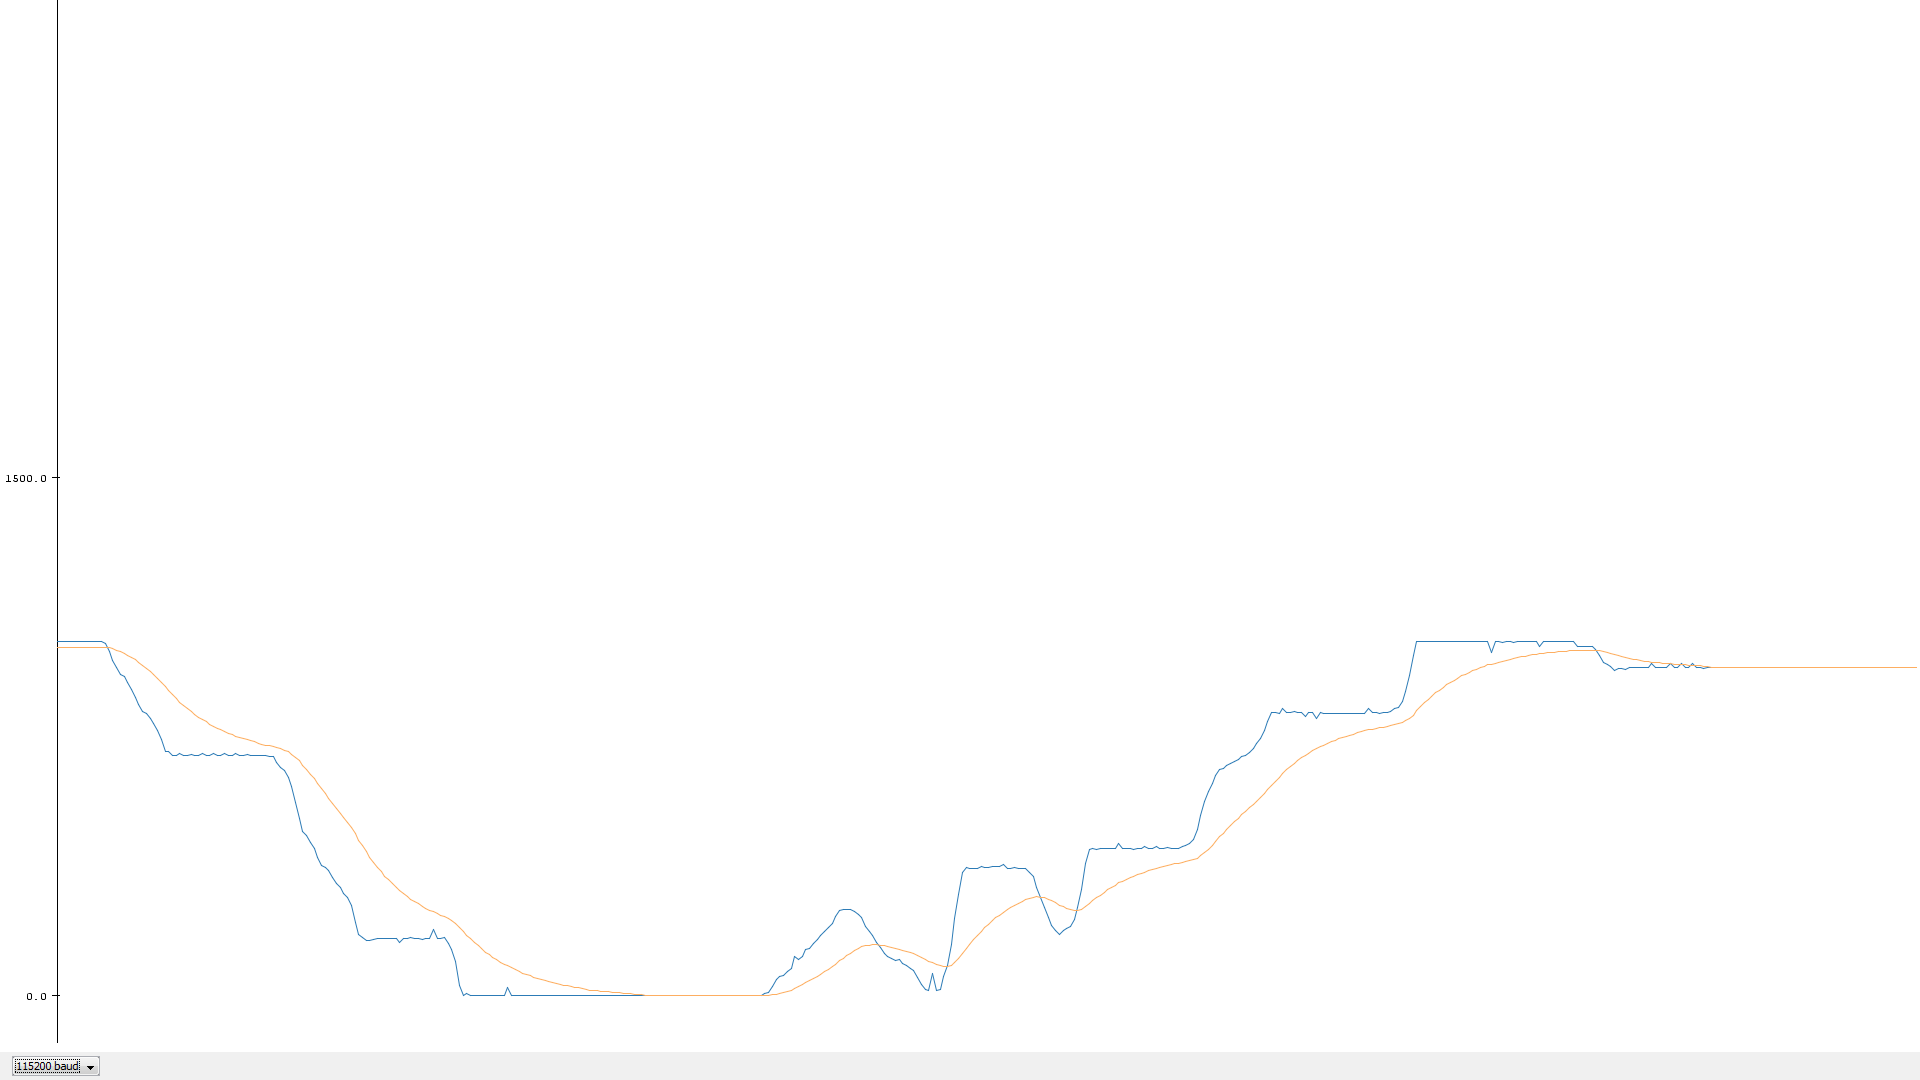
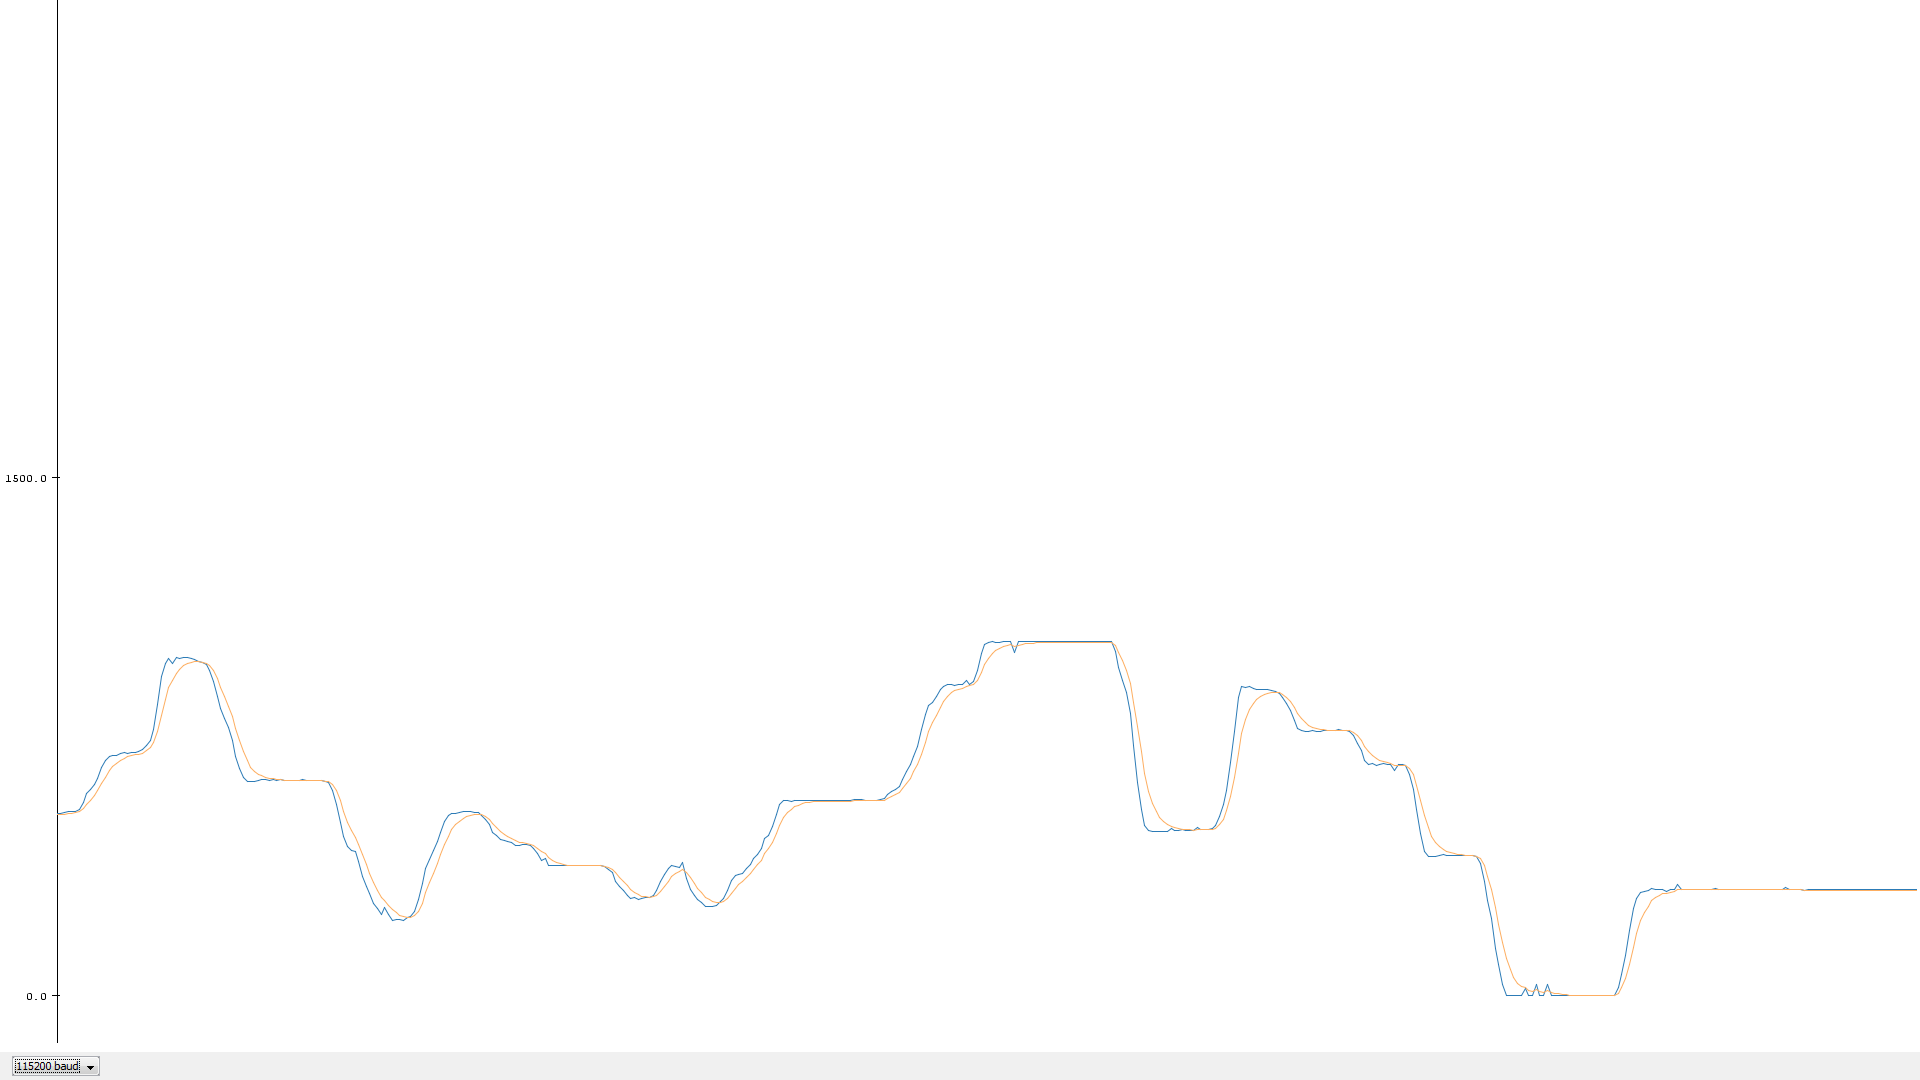
Arduino’s serial plotter is really easy to use. Instead of just showing a bunch of numbers and/or characters like the serial monitor does, the serial plotter actually draws the numbers over time, where the y-axis is the value and the x-axis is the time. This results in a graph of any numeric variables drawn in real-time.
The y-axis has a simple auto-zoom feature which adapts to the values while the x-axis shows the last x amount of lines (i.e. samples). A delay of 20ms in the main loop makes the serial plotter show approx. the last 15 seconds of data (without much processing time within the loop itself). Increase this delay, that is print less frequently, to slow down the rolling x-axis.
The serial plotter feature has existed in the Arduino IDE for some time now, but the most recent release makes it possible to plot multiple variables at the same time so that you can visually compare them. We have made a physical example where this feature can come in handy.
Our Example
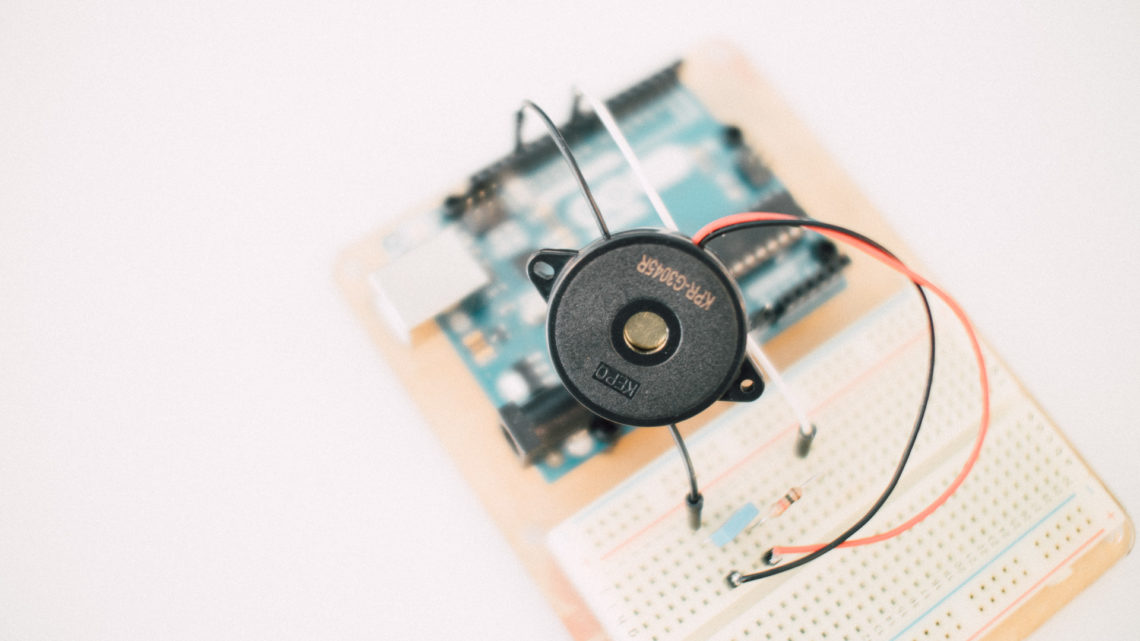
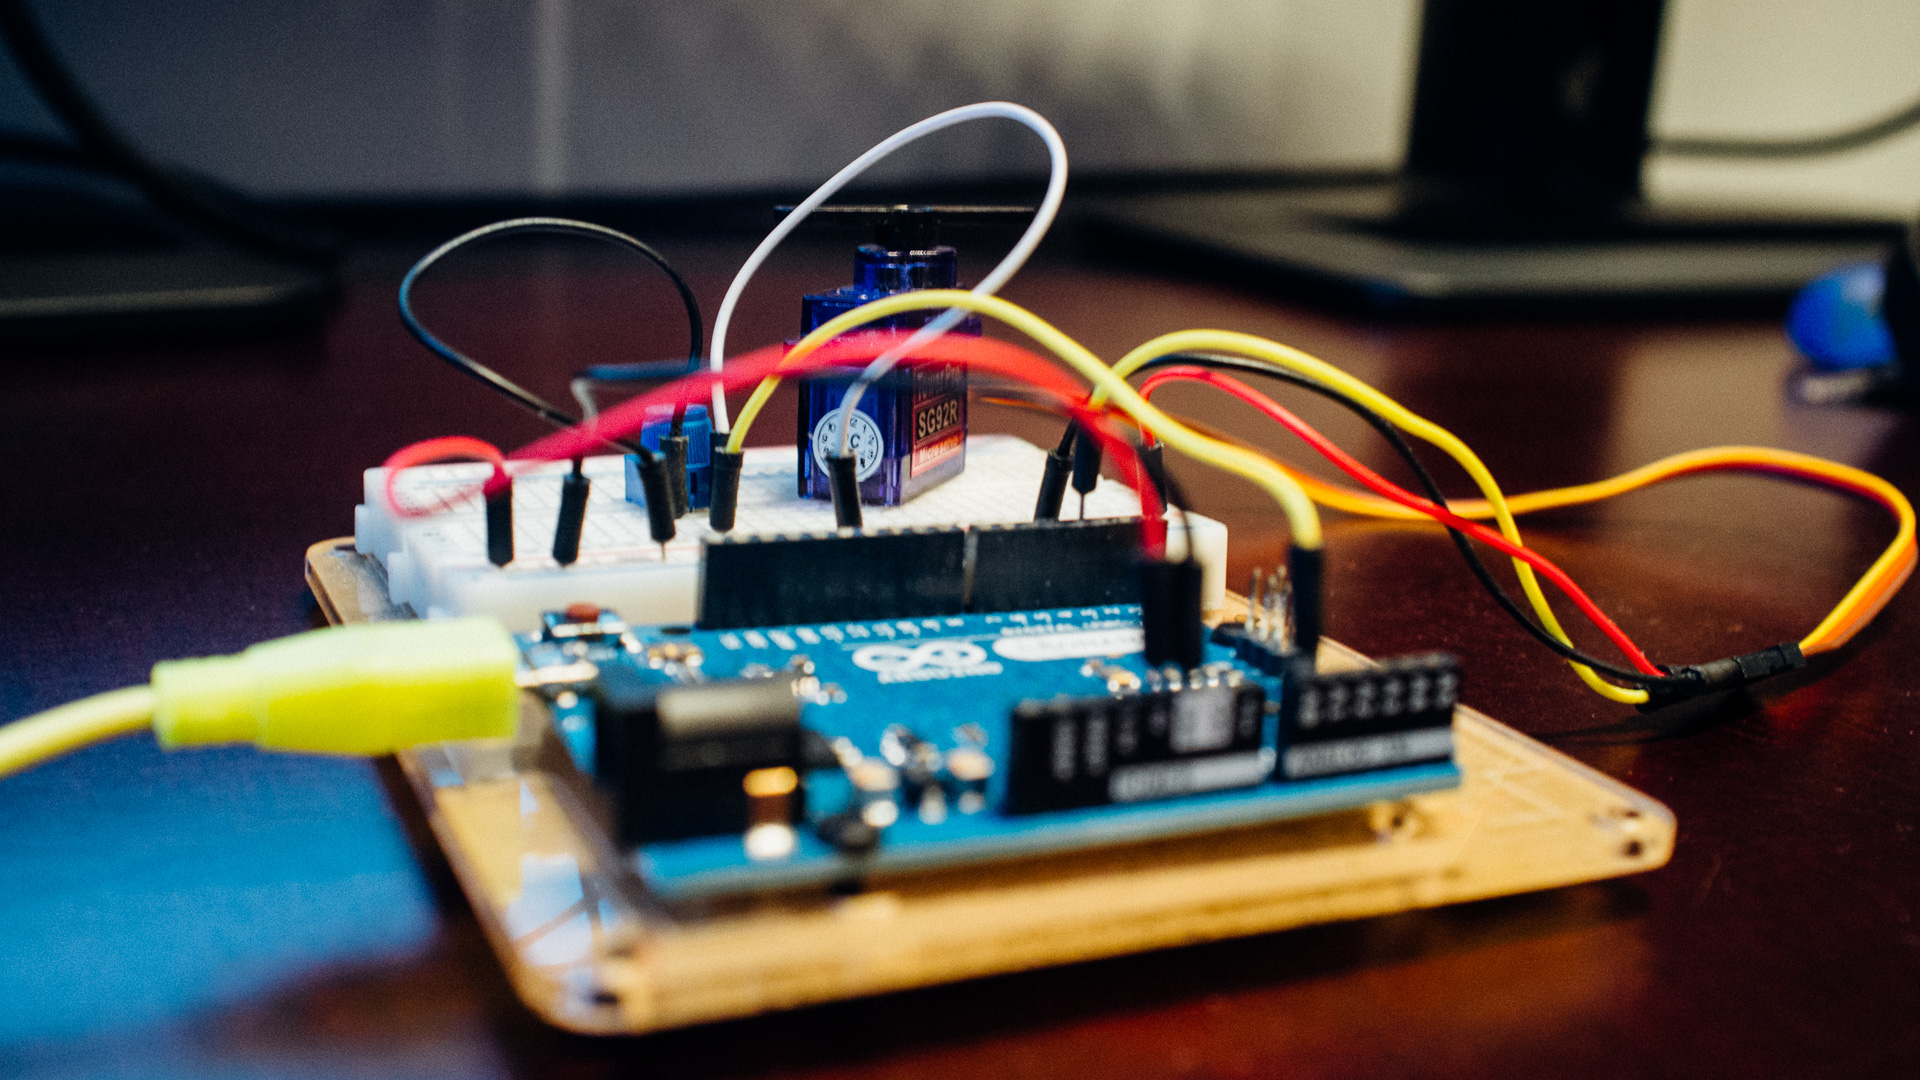
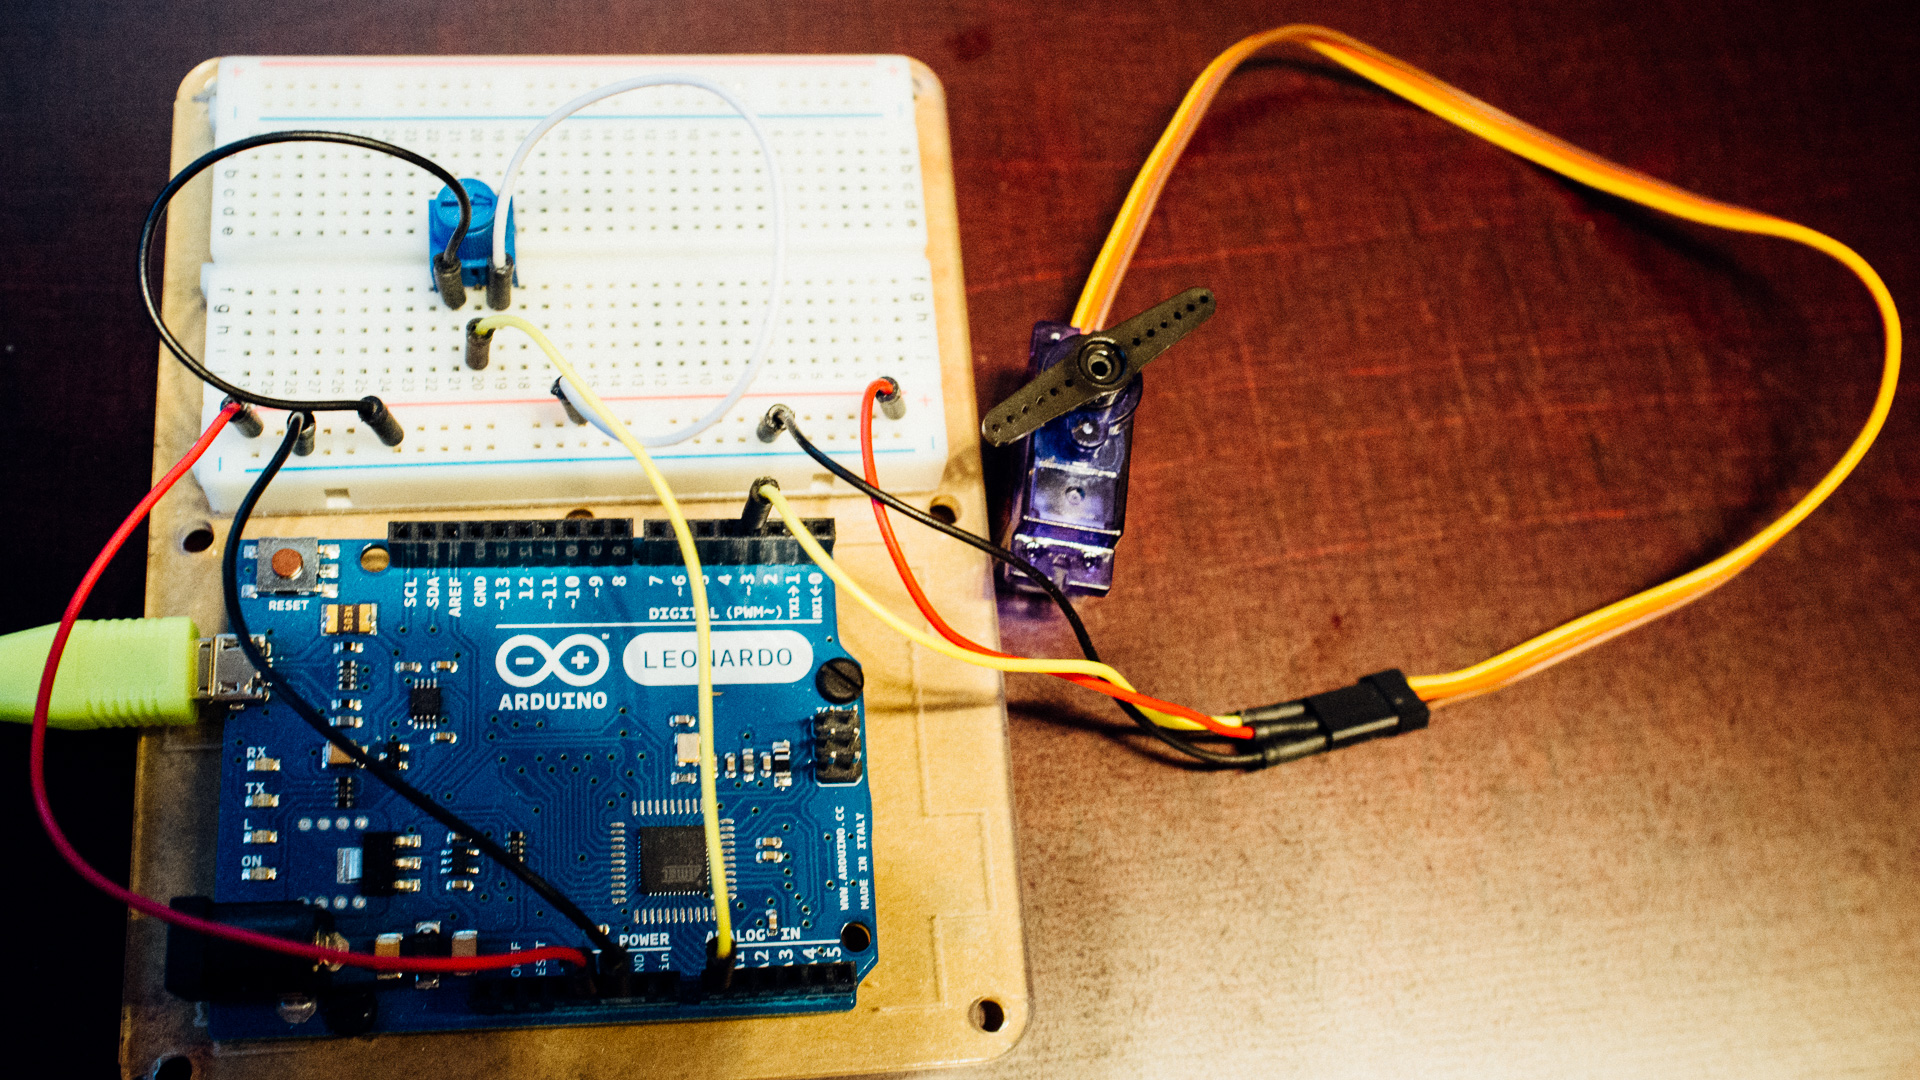
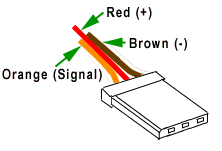
In our example we’ll use almost the same setup as in this tutorial. Hardware-wise, we only add a generic RC micro servo to digital pin 3. It also needs to be connected to 5V and GND.
 Software-wise we’ll use the same type of Exponential Moving Average filter (EMA) and you can read the same tutorial for explanations around this, communicating over serial and the ADC as well.
In the code we’ve added lines for printing to serial plotter as well as lines for servo control.
#include <Servo.h>

Servo myservo;			//create servo object

//Global Variables
int sensorPin = 0;		//pin number to use the ADC
int sensorValue = 0;	//initialization of sensor variable, equivalent to EMA Y
float EMA_a = 0.06;		//initialization of EMA alpha
int EMA_S = 0;			//initialization of EMA S
int EMA_S_map = 0;		//initialization of variable for servo control

void setup(){
	Serial.begin(115200);				//setup of Serial module, 115200 bits/second
	EMA_S = analogRead(sensorPin);		//set EMA S for t=1
	myservo.attach(3);					//servo initialization
}

void loop(){
	sensorValue = analogRead(sensorPin);				//read the sensor value using ADC
	EMA_S = (EMA_a*sensorValue) + ((1-EMA_a)*EMA_S);	//run the EMA

	Serial.print(sensorValue);		//the first variable for plotting
	Serial.print(",");				//seperator
	Serial.println(EMA_S);			//the second variable for plotting including line break

	EMA_S_map = map(EMA_S, 0, 1023, 0, 180);	//map ADC values to servo values (0-180)
	myservo.write(EMA_S_map);					//send the latest value to the servo

	delay(20);			//20ms delay
}
The meat of this code is within the loop() function, which is the part that repeats over and over again. First we read the pin connected to the potentiometer using the ADC and get a value between 0 and 1023. Then we crunch this value through the EMA before printing both the raw value from the pot (sensorValue) and the filtered value (EMA_S). Lastly we map the filtered value to the servo-range and move the servo. The last line is a 20ms delay to pump the brakes a tad so that we get around 50 new samples each second for the plotter.
The lines relevant to the printing are 22, 23 and 24. Notice line 24 where we call the Serial.println() function. This sends a line break at the end of the string as opposed to Serial.print(). When the serial plotter receives a line break, it plots all values on that line as one time step. Each variable need to be seperated by either a comma or a space (might work with other characters as well).
The servo-related lines are mostly basic stuff which is required for controlling a servo in general. Lines 1, 3 and 15 are all required, where the latter defines what Arduino pin should control the servo. Line 26 contains a handy Arduino-function called map() which linearly translates a set of numerical values to a second set of numerical values. It makes sense to use this function in this setting since we get 1024 different values from the ADC and since the servo takes values from 0 through 180.
Upload the code to your Arduino and press ctrl+shift+L to see the serial plotter in action! Choose different values for EMA_a (between 0 and 1) to change the cutoff frequency. 0.06 is pretty low, which results in a low cutoff frequency, and thus a very smooth and slow filtered signal.
Final Thoughts
Usually you want to have the printing frequency seperated from the frequency of the actual task you want to perform. In our example, if we would want to print only 10 times per second, the servo would also just update its position 10 times per second (which is pretty infrequent). So, the best way to do this is to put the main loop lines relevant to printing in an own function and call this function as often as you want to print to the serial plotter.
The servo is not at all necessary for this example with regards to printing to the serial plotter, but we thought it be a fun way to physically visualize the filtered signal.