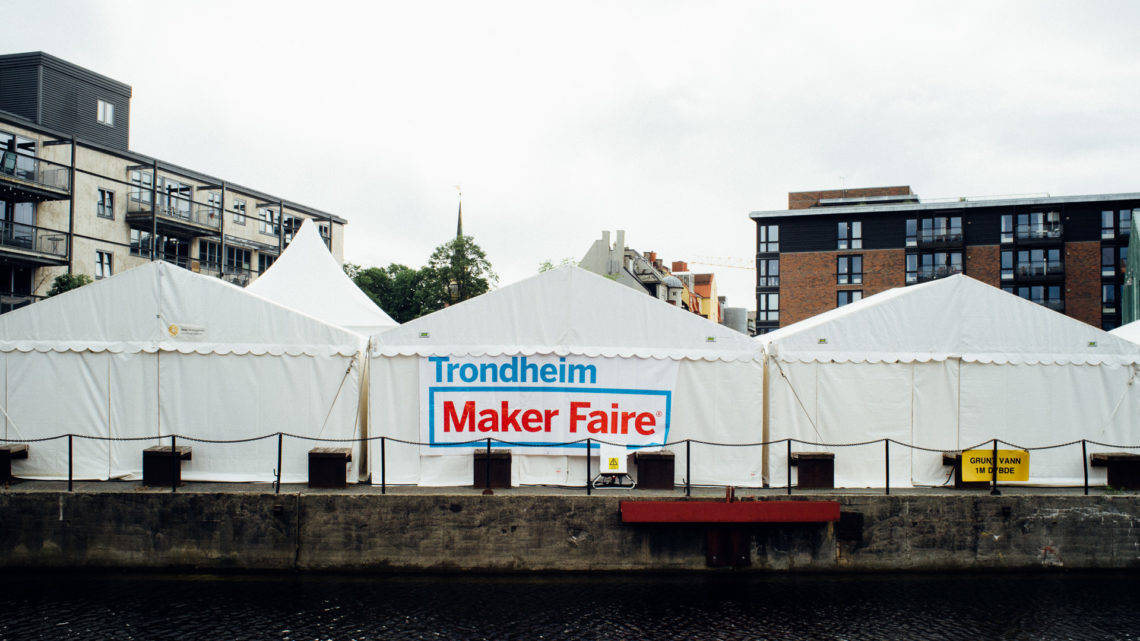
As many of you already know, we had a Reaction Game at our stand at this year’s Trondheim Maker Faire. During the two days of the Maker Faire we had around a thousand people playing our Reaction Game. We logged all the participants’ age and reaction time, and have some statistics as well as a few graphs for you to look at.
At a later date we will go into more details of how we built this installation. In the meantime you can take a look at this post where you can watch a behind the scenes video of the building process.
Test procedure
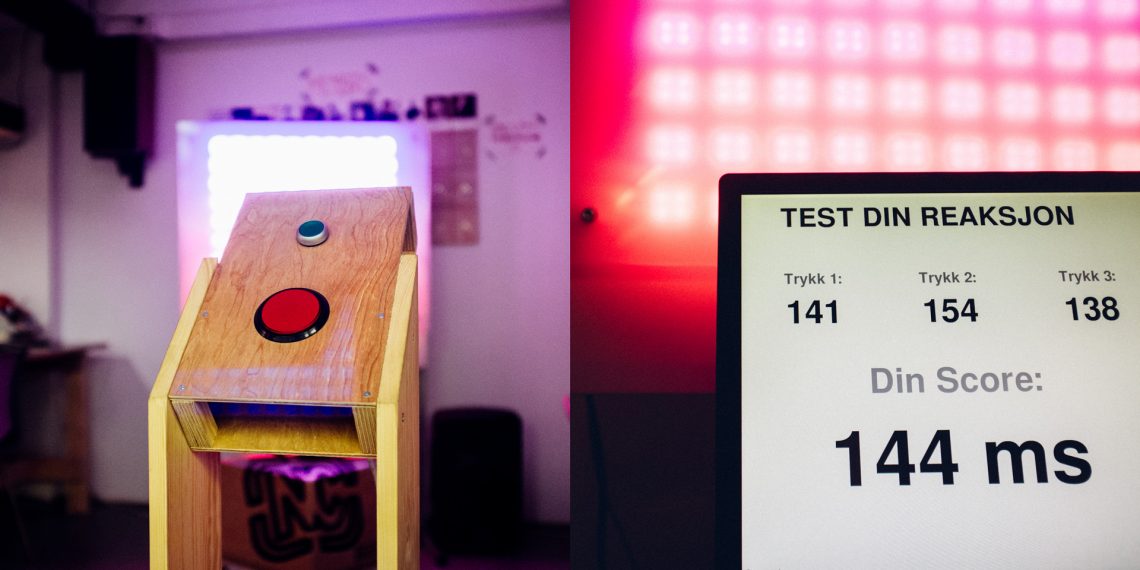
Each game is as follows:
- Age is inserted, LED matrix fades down
- 3 times:
- The LED matrix flash white after a random amount of time.
- The player presses the red button as fast as possible after the flash.
- Time between the flash and the button press is recorded.
- The 3 different times and the average is displayed.
Reaction Time vs Age
Below you can see a graph where every bubble is a single reaction (click on the image for a larger version). The vertical axis is the reaction time and the horizontal axis is the player age. The black line is the average reaction time for each age. The peaks at the far right are due to few players in that age range.
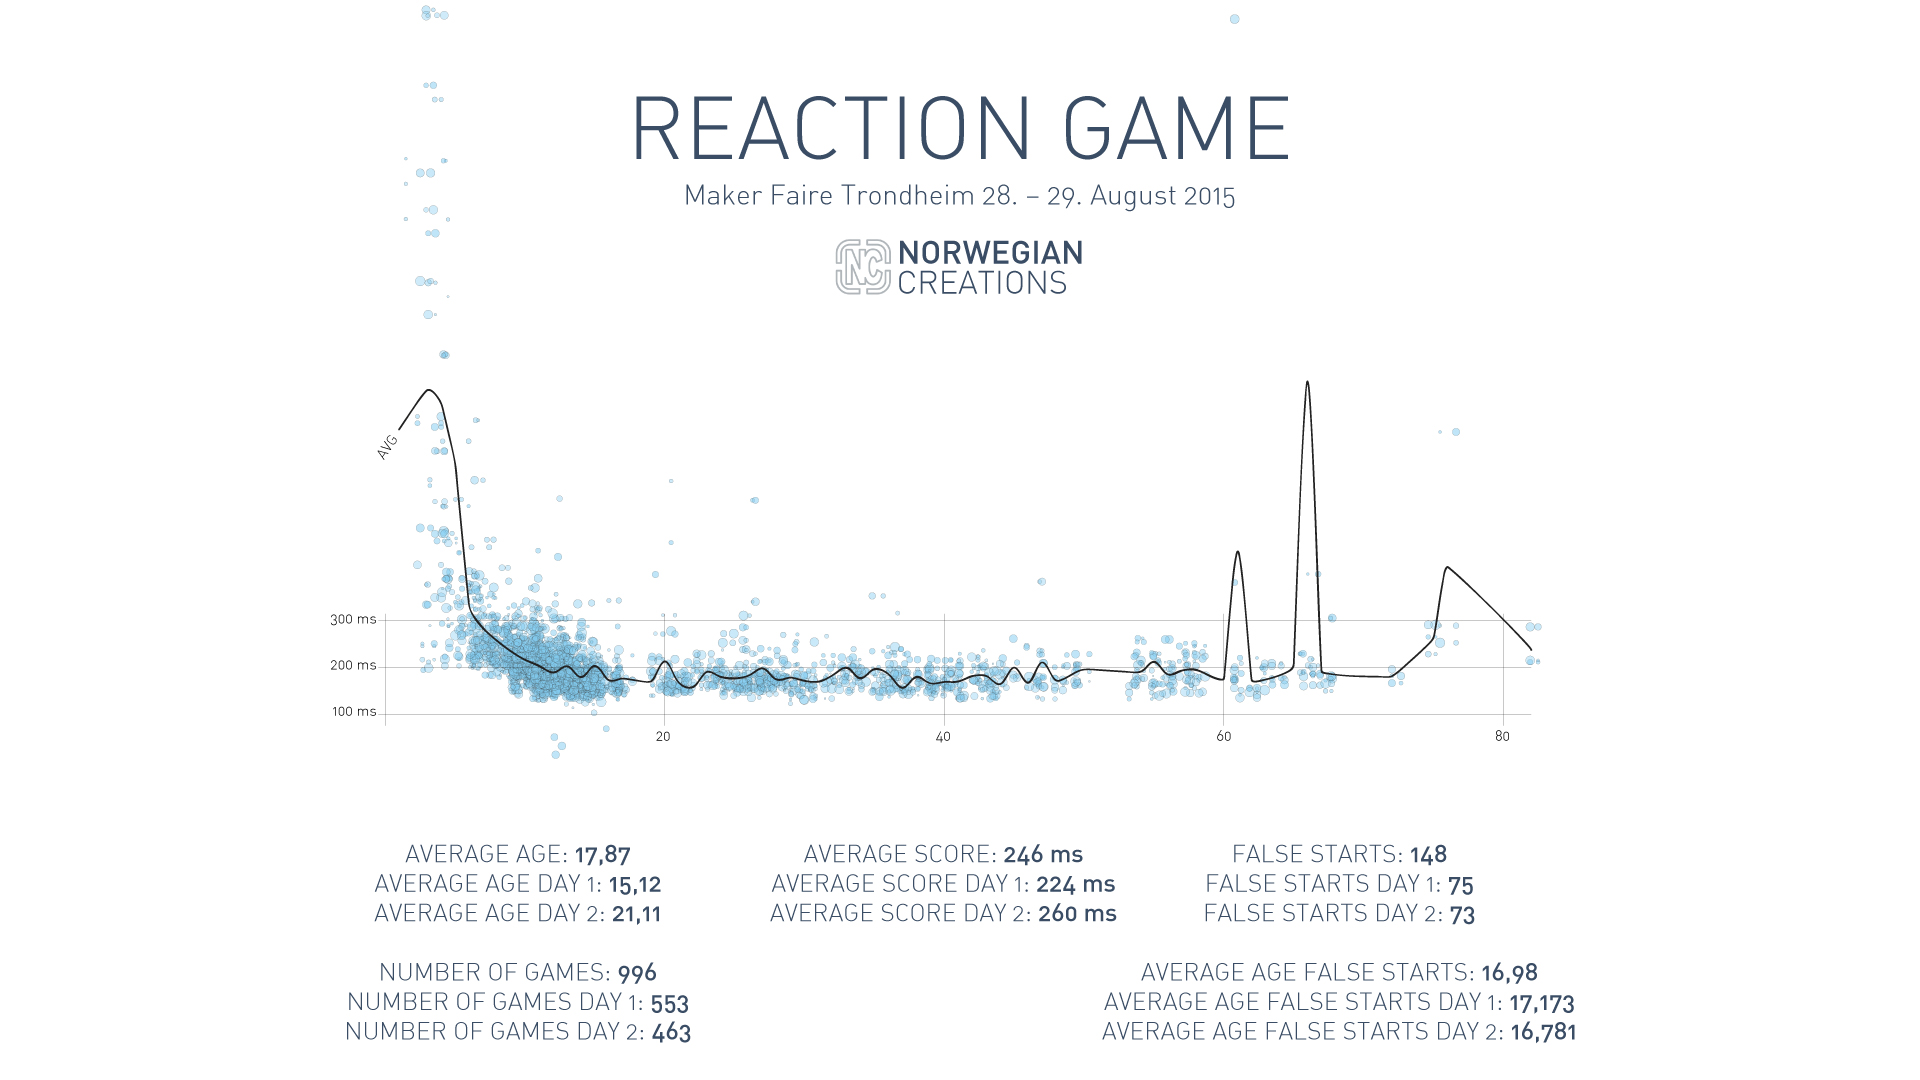
We have also included a few stats above which are quite interesting. Day 1 had a lot of school kids, hence the lower average age compared to day 2.
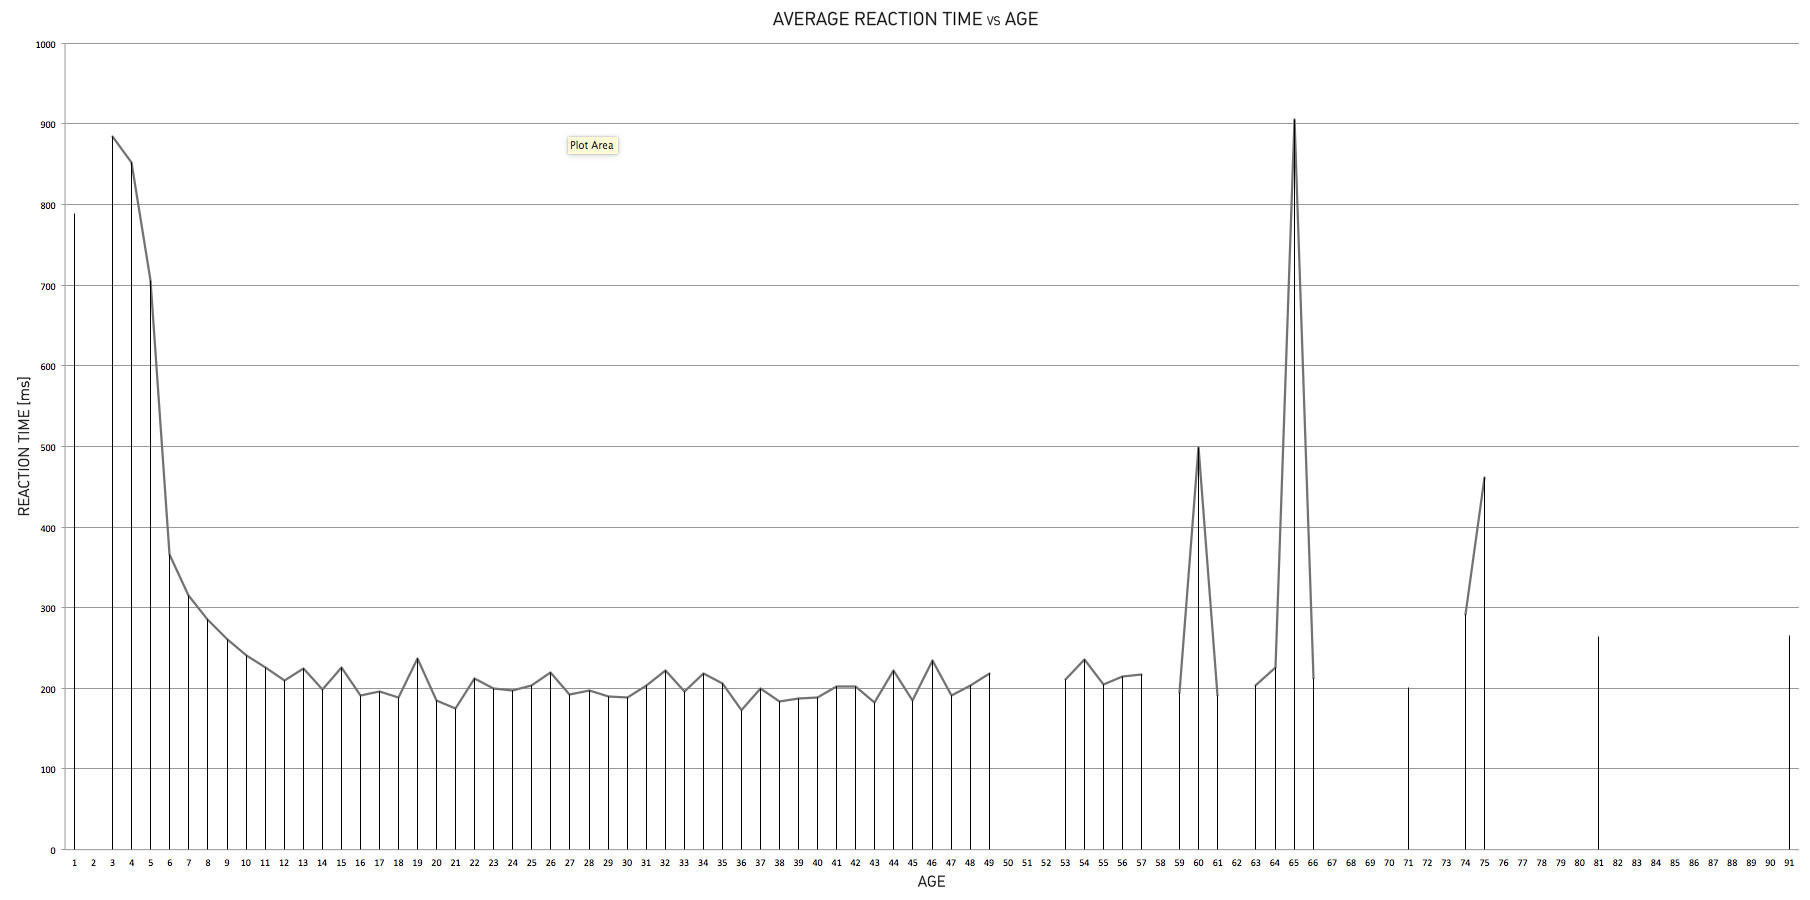
Below is another graph showing more or less the same as the graph above.
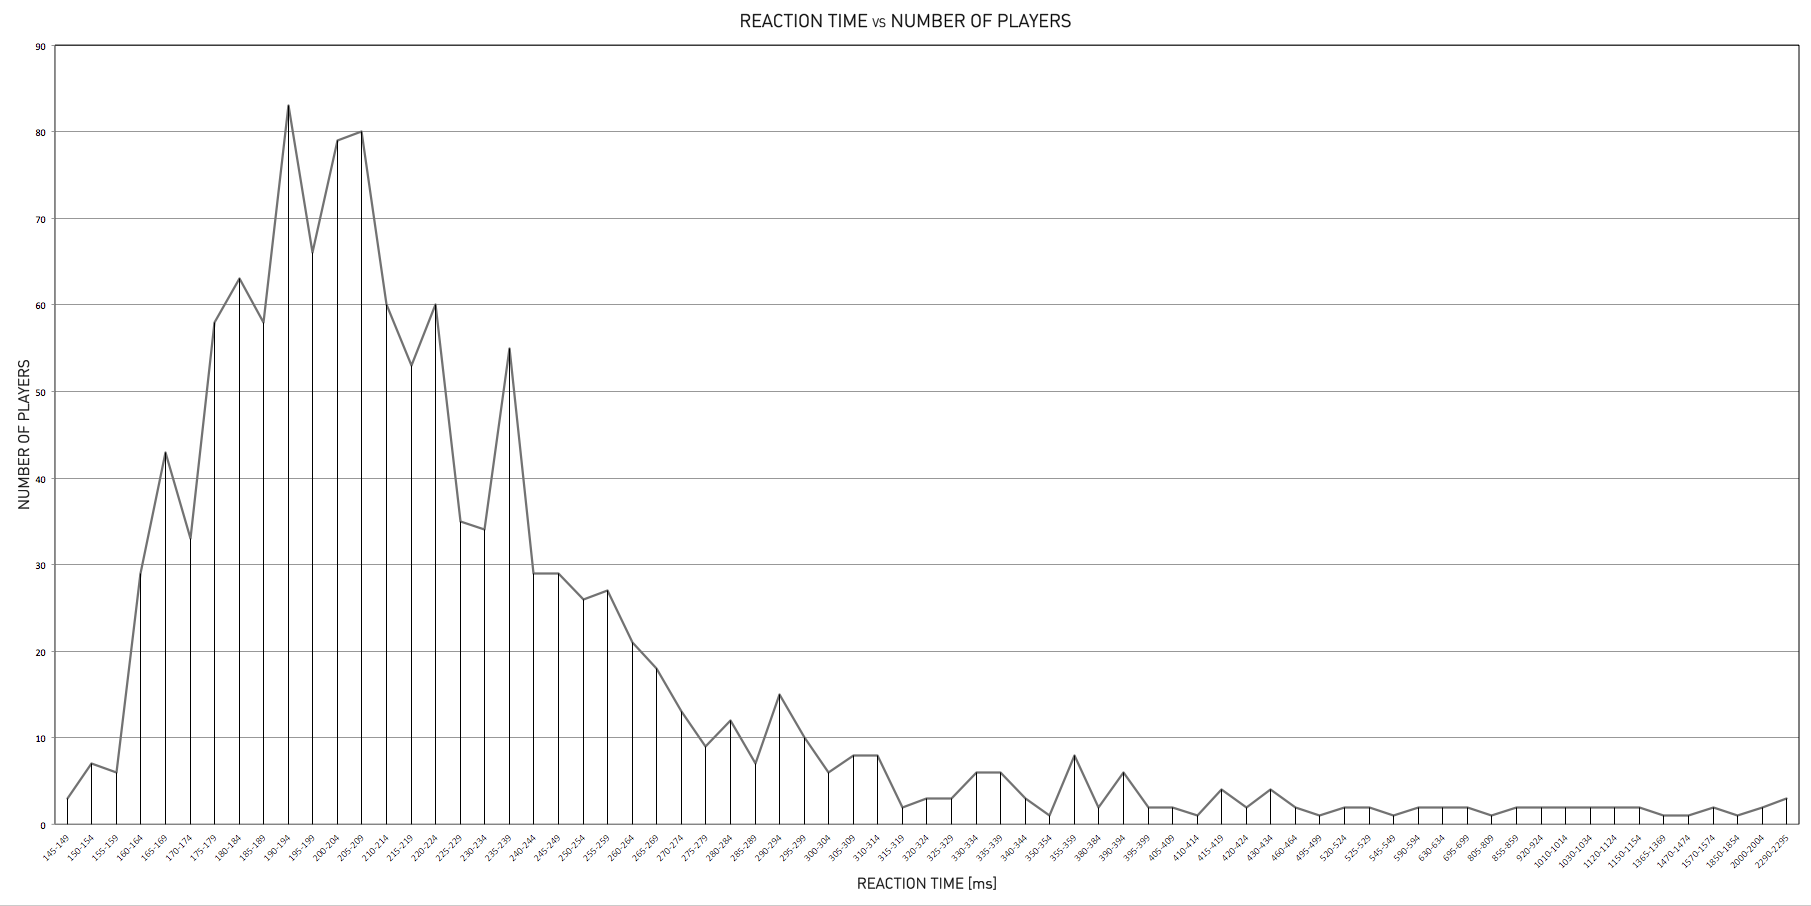
Reaction Time vs Number of Players
We also thought it’d be interesting to plot a graph where we can see the “global” reaction time regardless of the age of the player. This gives us the distribution graph below.
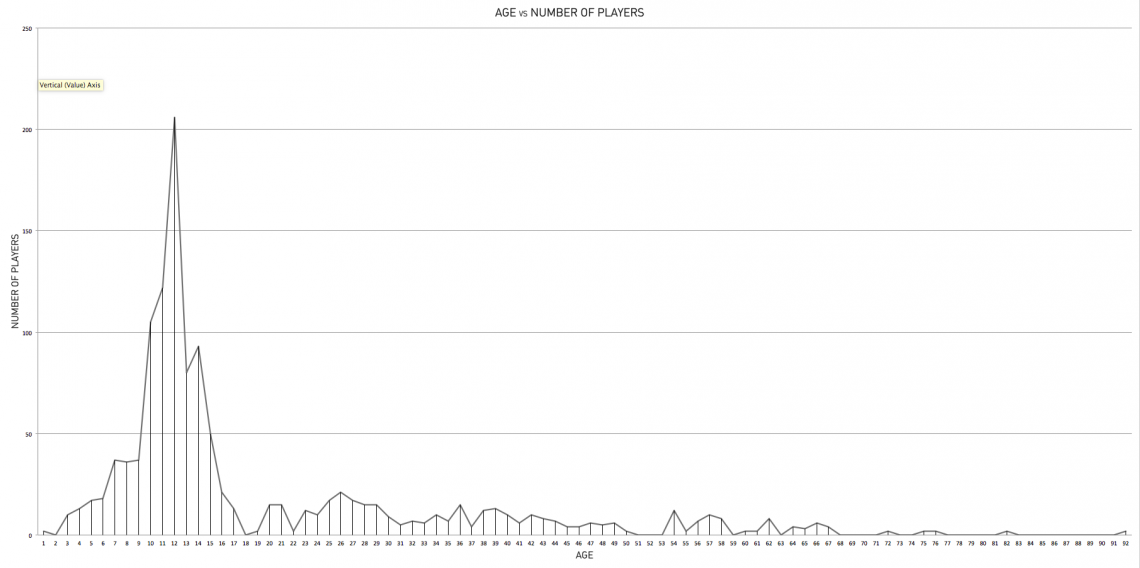
Demographics
The last graph we’re going to show you doesn’t have anything to do with reaction time. It’s rather a pure demographical graph which shows the age of our players.
 Conclusion

It’s easy to think that reaction time would increase with age. However, our observations shows that this is not necessarily true. As long as the player is above approx. 10 years old, the reaction time is quite constant regardless of age. Our oldest players were so few that it doesn’t really give an adequate insight into the reaction time of that age spectrum. When it comes to the discussion around older people potentially being worse car drivers, we believe that has more to do with focus and understanding the traffic pattern than pure reaction time.
Another observation that is somewhat interesting is the significant increase in reaction time when the age decreases down from 11 years old.
As already mentioned, we will come back to this machine in a later post with some technical insights from the building process, so stay tuned!