A project that encapsulates tech+art is real-time audio spectrum analysis (and display)
But what exactly does that mean, and why is it so fascinating?
We’ll dive into the basics of audio spectrum analysis, explore how it can be visualized in real-time, and showcase a working demo powered by a Teensy microcontroller.
Note that we have written more about the FFT-algorithm in this blog post, but in this post we will use it to visualize an audio spectrum on a simple led matrix in “real time“.
What is Real-Time Audio Spectrum Analysis?
Audio spectrum analysis involves breaking down a complex audio signal into its individual frequency components.
Imagine listening to a song and being able to see the bass, mid-range, and treble frequencies as distinct visual elements
That’s what audio spectrum analysis allows us to do.
By applying algorithms like the Fast Fourier Transform (FFT), we can take a time-domain audio signal and convert it into a frequency-domain representation. This gives us a snapshot of which frequencies are present in the sound at any given moment and how strong they are.
But why is this useful?
Spectrum analysis is an essential tool in various fields, from audio engineering to electronics. It helps amongst others audio engineers understand and tweak the sound quality of recordings, allows hobbyists to create mesmerizing visualizations, and assists in diagnostics and troubleshooting in electronic systems, compliance testing, radio frequency transmission etc.
The system
As mentioned in the earlier blogpost, FFT is a rather resource-intensive calculation.
But the Teensy is hardware-capable enough for “real time human” audio spectrum analysis.
And combined with the Teensy Audio Shield, this was an easy choice.
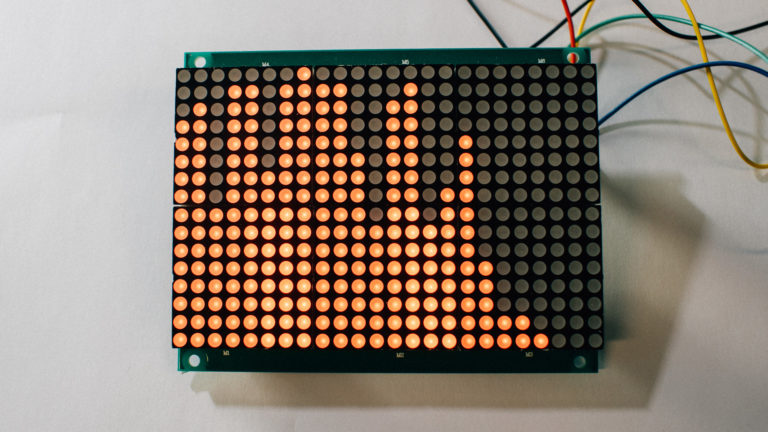
In our quick demo, the Teensy (incl. “Audio Shield“) takes in an audio signal, processes it through the FFT algorithm, and then displays the resulting frequency data on an LED matrix. The result is a dynamic display that dances to the rhythm of the music.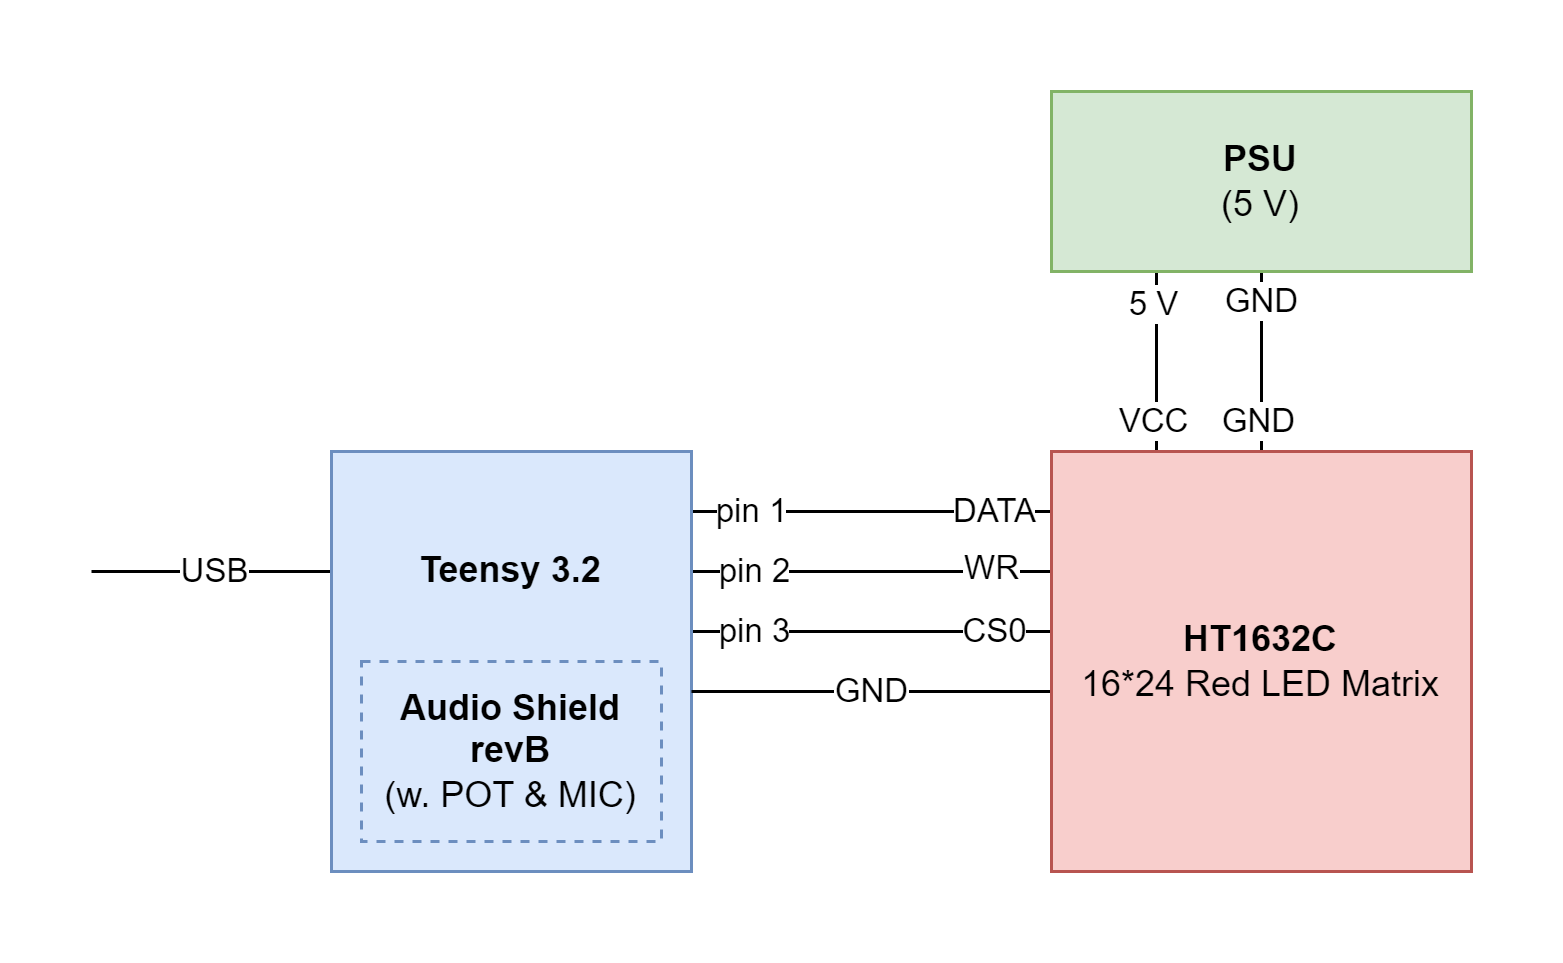
The code
This heavily based on the spectrum-analyzer-example for the Teeny Audio Shield:
#include <Audio.h>
#include <Wire.h>
#include <SPI.h>
#include <SD.h>
#include <SerialFlash.h>
#include "Adafruit_HT1632.h"

#define HT_WIDTH 24
#define HT_HEIGHT 16

#define HT_DATA 1
#define HT_WR 2
#define HT_CS 3

// GUItool: begin automatically generated code
AudioInputI2S i2s1;           //xy=139,91
AudioMixer4 mixer1;           //xy=312,134
AudioOutputI2S i2s2;          //xy=392,32
AudioAnalyzeFFT1024 fft1024;  //xy=467,147
AudioConnection patchCord1(i2s1, 0, mixer1, 0);
AudioConnection patchCord2(i2s1, 0, i2s2, 0);
AudioConnection patchCord3(i2s1, 1, mixer1, 1);
AudioConnection patchCord4(i2s1, 1, i2s2, 1);
AudioConnection patchCord5(mixer1, fft1024);
AudioControlSGTL5000 audioShield;  //xy=366,225
// GUItool: end automatically generated code

const int myInput = AUDIO_INPUT_MIC;

// The scale sets how much sound is needed in each frequency range to
// show all bars. Higher numbers are more sensitive.
float scale = 60.0;

// An array to hold the frequency bands
float level[HT_WIDTH];

// This array holds the on-screen levels.  When the signal drops quickly,
// these are used to lower the on-screen level 1 bar per update, which
// looks more pleasing to corresponds to human sound perception.
int shown[HT_WIDTH];

Adafruit_HT1632LEDMatrix matrix = Adafruit_HT1632LEDMatrix(HT_DATA, HT_WR, HT_CS);

void ht1632_show_bar(uint8_t bar_number, uint8_t bar_height)
{
  for (uint8_t i = 0; i < HT_HEIGHT; i++)
  {
    if (i < bar_height)
    {
      matrix.setPixel(bar_number, i);
    }
    else
    {
      matrix.clrPixel(bar_number, i);
    }
  }
}

void setup()
{
  // Audio requires memory to work
  AudioMemory(12);

  // Enable the audio shield and set the output volume
  audioShield.enable();
  audioShield.inputSelect(myInput);
  audioShield.volume(0.5);

  // configure the mixer to equally add left & right
  mixer1.gain(0, 0.5);
  mixer1.gain(1, 0.5);

  matrix.begin(ADA_HT1632_COMMON_16NMOS);
}


void loop()
{

  if (fft1024.available())
  {
    // read the 512 FFT frequencies into 24 levels
    // music is heard in octaves, but the FFT data
    // is linear, so for the higher octaves, read
    // many FFT bins together. Turn around because matrix
    level[23] = fft1024.read(0);
    level[22] = fft1024.read(1);
    level[21] = fft1024.read(2);
    level[20] = fft1024.read(3, 4);
    level[19] = fft1024.read(5, 6);
    level[18] = fft1024.read(7, 9);
    level[17] = fft1024.read(10, 12);
    level[16] = fft1024.read(13, 16);
    level[15] = fft1024.read(17, 21);
    level[14] = fft1024.read(22, 27);
    level[13] = fft1024.read(28, 34);
    level[12] = fft1024.read(35, 43);
    level[11] = fft1024.read(44, 54);
    level[10] = fft1024.read(55, 67);
    level[9] = fft1024.read(68, 83);
    level[8] = fft1024.read(84, 102);
    level[7] = fft1024.read(103, 125);
    level[6] = fft1024.read(126, 153);
    level[5] = fft1024.read(154, 188);
    level[4] = fft1024.read(189, 230);
    level[3] = fft1024.read(231, 281);
    level[2] = fft1024.read(282, 343);
    level[1] = fft1024.read(344, 419);
    level[0] = fft1024.read(420, 511);
    // See this conversation to change this to more or less than 24 log-scaled bands?
    // https://forum.pjrc.com/threads/32677-Is-there-a-logarithmic-function-for-FFT-bin-selection-for-any-given-of-bands

    // adjust the full scale signal with the audio shield pot
    scale = 8.0 + analogRead(A1) / 5.0;

    uint8_t val = 0;

    for (uint8_t x = 0; x < HT_WIDTH; x++)
    {

      // Conversion from FFT data to display bars should be exponentially scaled (not done here)
      val = level[x] * scale;

      if (val > HT_HEIGHT) val = HT_HEIGHT;

      if (val >= shown[x])
      {
        shown[x] = val;
      }
      else
      {
        if (shown[x] > 0) shown[x] = shown[x] - 1;
      }

      // print each bar
      if (shown[x] == 0)
      {
        ht1632_show_bar(x, 0);
      }
      else
      {
        ht1632_show_bar(x, shown[x]);
      }
    }

    matrix.writeScreen();
  }
}
The result and some final words
Real-time audio spectrum analysis and display are more than just technical feats — they’re a form of modern-day art that blends engineering, programming, and creativity.
By using the Teensy microcontroller and FFT algorithms, we can transform sound into a visual experience.
Whether you’re an audio engineer looking to gain deeper insights into your recordings, or a maker searching for your next project, exploring audio spectrum analysis opens up a world of possibilities.
Check out the demo video to see it in action, and feel free to share your own projects with us 🙂